

MarkeScope Stock Screener app for iPhone and iPad
Developer: Symbyo Technologies
First release : 16 May 2012
App size: 2.54 Mb
MarkeScope App is the first stock screener that adds risk measures in the screening criteria along the normal measures that the portfolio managers or traders use when creating screening filters. You can choose from several risk measures to create your own filtering criteria.
MarkeScope also has the following features:
Database supports up to 7000 different stocks.
Includes all USA stock exchanges:
- NYSE
- Nasdaq
- AMEX
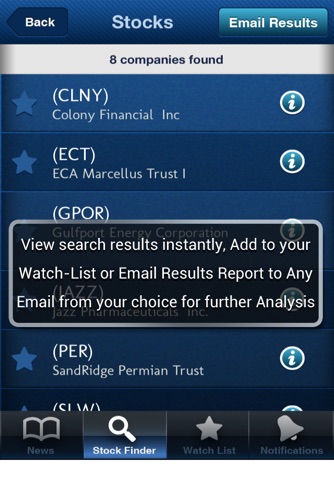
Send reports that include the screening results or a security of your interest; The stock report includes all the ratios related to this stock.
Recommend the stock on your twitter, Facebook account or via sending SMS to traders, clients or your colleagues.
Search what is being said about the stock on twitter or Google.
Stocks can be followed even after it’s downgraded to Pink Sheets and OTC Market.
Our database covers more than 140 Industries and 16 Sectors.
Markescope App supports Fundamental, Technical, Descriptive, Risk, Price & Performance Ratios.
Use Risk and Performance Stats based on Daily, Monthly and Annual Stock Data.
View how the filtered stocks are matching the criteria. (Per each stock)
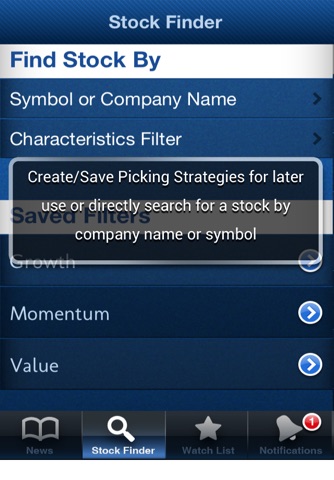
Save different search filters with his/her preferred set of criteria to use at anytime.
Create watch lists from search results to follow desired stocks.
User can set alerts on chosen stock & get notifications if the stock fulfilled his/her placed attributions on all his/her devices on which the application is installed.
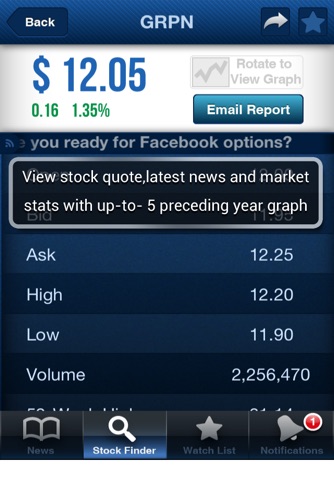
View stock current summary and prices graph up to 5 preceding years.
View general market news and his/her favourite stocks news.Simple interface. Extreme ease of use.
Customizable criteria value set/ ranges (between, more than , less than)
New IPOs are supported; Our database is updated daily.
Quotes are delayed by:15 -20 Minutes
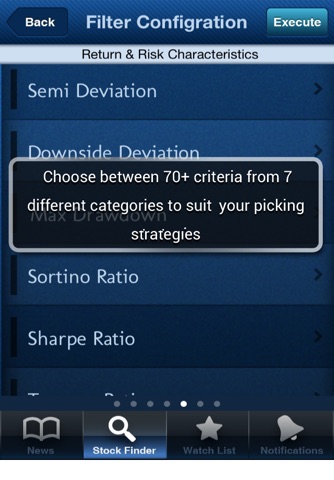
Filter Categories & Criterias Supported:
1. Risk Characteristics (Advance):
- Standard Deviation
- Annualized SD
- Semi Deviation
- Downside Deviation
- Max Drawdown
- Sortino Ratio
- Sharpe Ratio
- Treynor Ratio
- Calmar Ratio
- Sterling Ratio
- Gain to loss Ratio
- Profit to loss Ratio
- Winning streak
- Losing streak
- Correlation coefficient vs S&P
- Information Ratio vs S&P
- Jensen Alpha vs S&P
- Beta vs S&P
- Average Return
- Average Gain
- Average Loss
2. Price and Ratio (Basic)
- Share price
- Price change
- Price Percent change
- Stock performance VS S&P 500
- High
- Open
- Low
- Volume
- 52-week High
- 52-week Low
3. Fundamental Analysis Characteristics: (Advanced)
- P/E Ratio
- PEG Ratio
- Market Capitalization
- EBITIDA
- Price/Sales
- Book Value
- Average daily volume
- Price/book
- EPS Growth Next Year
- EPS Growth (till end of year)
- Net Profit Margin (ttm)
- Earning Yield (ttm)
4. Technical Analysis Characteristics (Advanced)
-Percent Change From 52-week High
-Percent Change From 52-week Low
-Percent Change From 50-day Moving Average
-Percent Change From 200-day Moving Average
-Short Ratio
-Float shares
5. Earnings and Dividends: (Basic)
-Earnings per share
-Dividend per share
-Dividend yield
-EPS CFY
-EPS NFY
-EPS Next Quarter
-P/E Current Year Estimate
-P/E Next Year Estimate
6. Descriptive: (Basic)
-Stock Exchange
-Sector
-Industry
-Revenue(ttm)
7. Performance: (Basic)
- 1 day
- 3 days
- 1 week
- Month-To-Date
- 1 month
- 3 months
- 6 months
- Year-To-Date
- 1 Year
- 3 Years
- 5 years